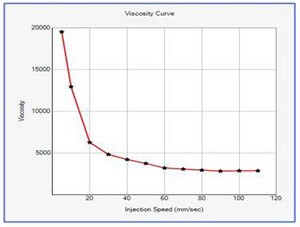
Shows effect of injection speed on viscosity Shows the most consistent region of viscosity Reduces lot to lot variation
CAUTION
May not be applicable to insert molded components May not be applicable to optical components Fast injection speeds may cause material degradation and burning
SUGGESTION
Inject as fast as you NEED to and not as fast as you can. Slower speeds are perfectly acceptable.
Step 2: Cavity Balance Study
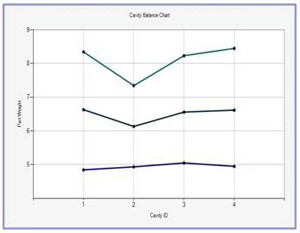
Shows the fill balance between all the cavities Helps in achieving better cavity to cavity consistency
CAUTION
% imbalance can be very deceiving on smaller parts
SUGGESTION
Study the % imbalance with the cavities almost full. Do not have an ‘acceptable imbalance limit’, example 3% or 5% or 10%. It should be on a case-to-case basis.
Step 3: Pressure Drop Study
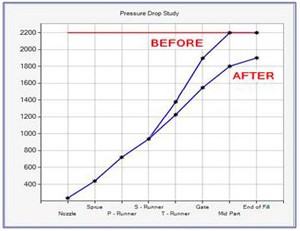
Shows if the process pressure is limited Helps in consistency
CAUTION
When increasing the pressure exercise caution to prevent mold damage
SUGGESTION
Record pressure drop through the nozzle and end of fill, the rest of the sections are important only if the process is pressure limited and can therefore be eliminated.
Step 4: Cosmetic Process Window Study
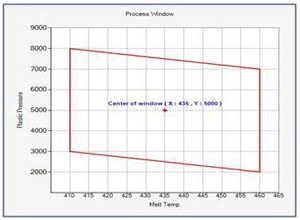
Shows the extent of capability of the mold to make cosmetically acceptable parts Bigger the window, better are the chances of consistency
CAUTION
When increasing the pressure exercise caution to prevent mold damage Higher pressures can cause the overpacking of the part
SUGGESTION
Do not use pressures of over 5000 psi plastic pressure over the lower end of the acceptable pressure. A large Cosmetic Process Window is the first step to a robust process.
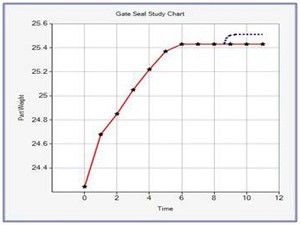
Step 5: Gate Seal Study
Shows when the gate seals Helps in shot to shot consistency
CAUTION
Do not perform a Gate Seal Study on a Hot Runner Mold With large gate sizes the graph may never flatten out – be careful of overpacking of the part With softer materials such as olefins the graph may never flatten out
SUGGESTION
When the graph does not flatten out consider the ‘Pack and Hold’ concept.
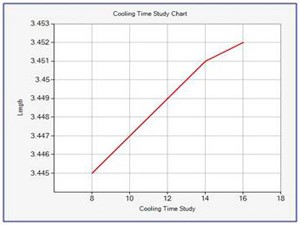
Step 6: Cooling Time Study
Shows the effect of cooling time Improves Cycle efficiency
CAUTION
When molding at lower cooling times, the mold takes a longer time to reach thermal equilibrium
SUGGESTION
Perform the study at the higher end of the melt or mold temperatures For olefins, set mold or melt temps to the lower side and work with the other on the higher side